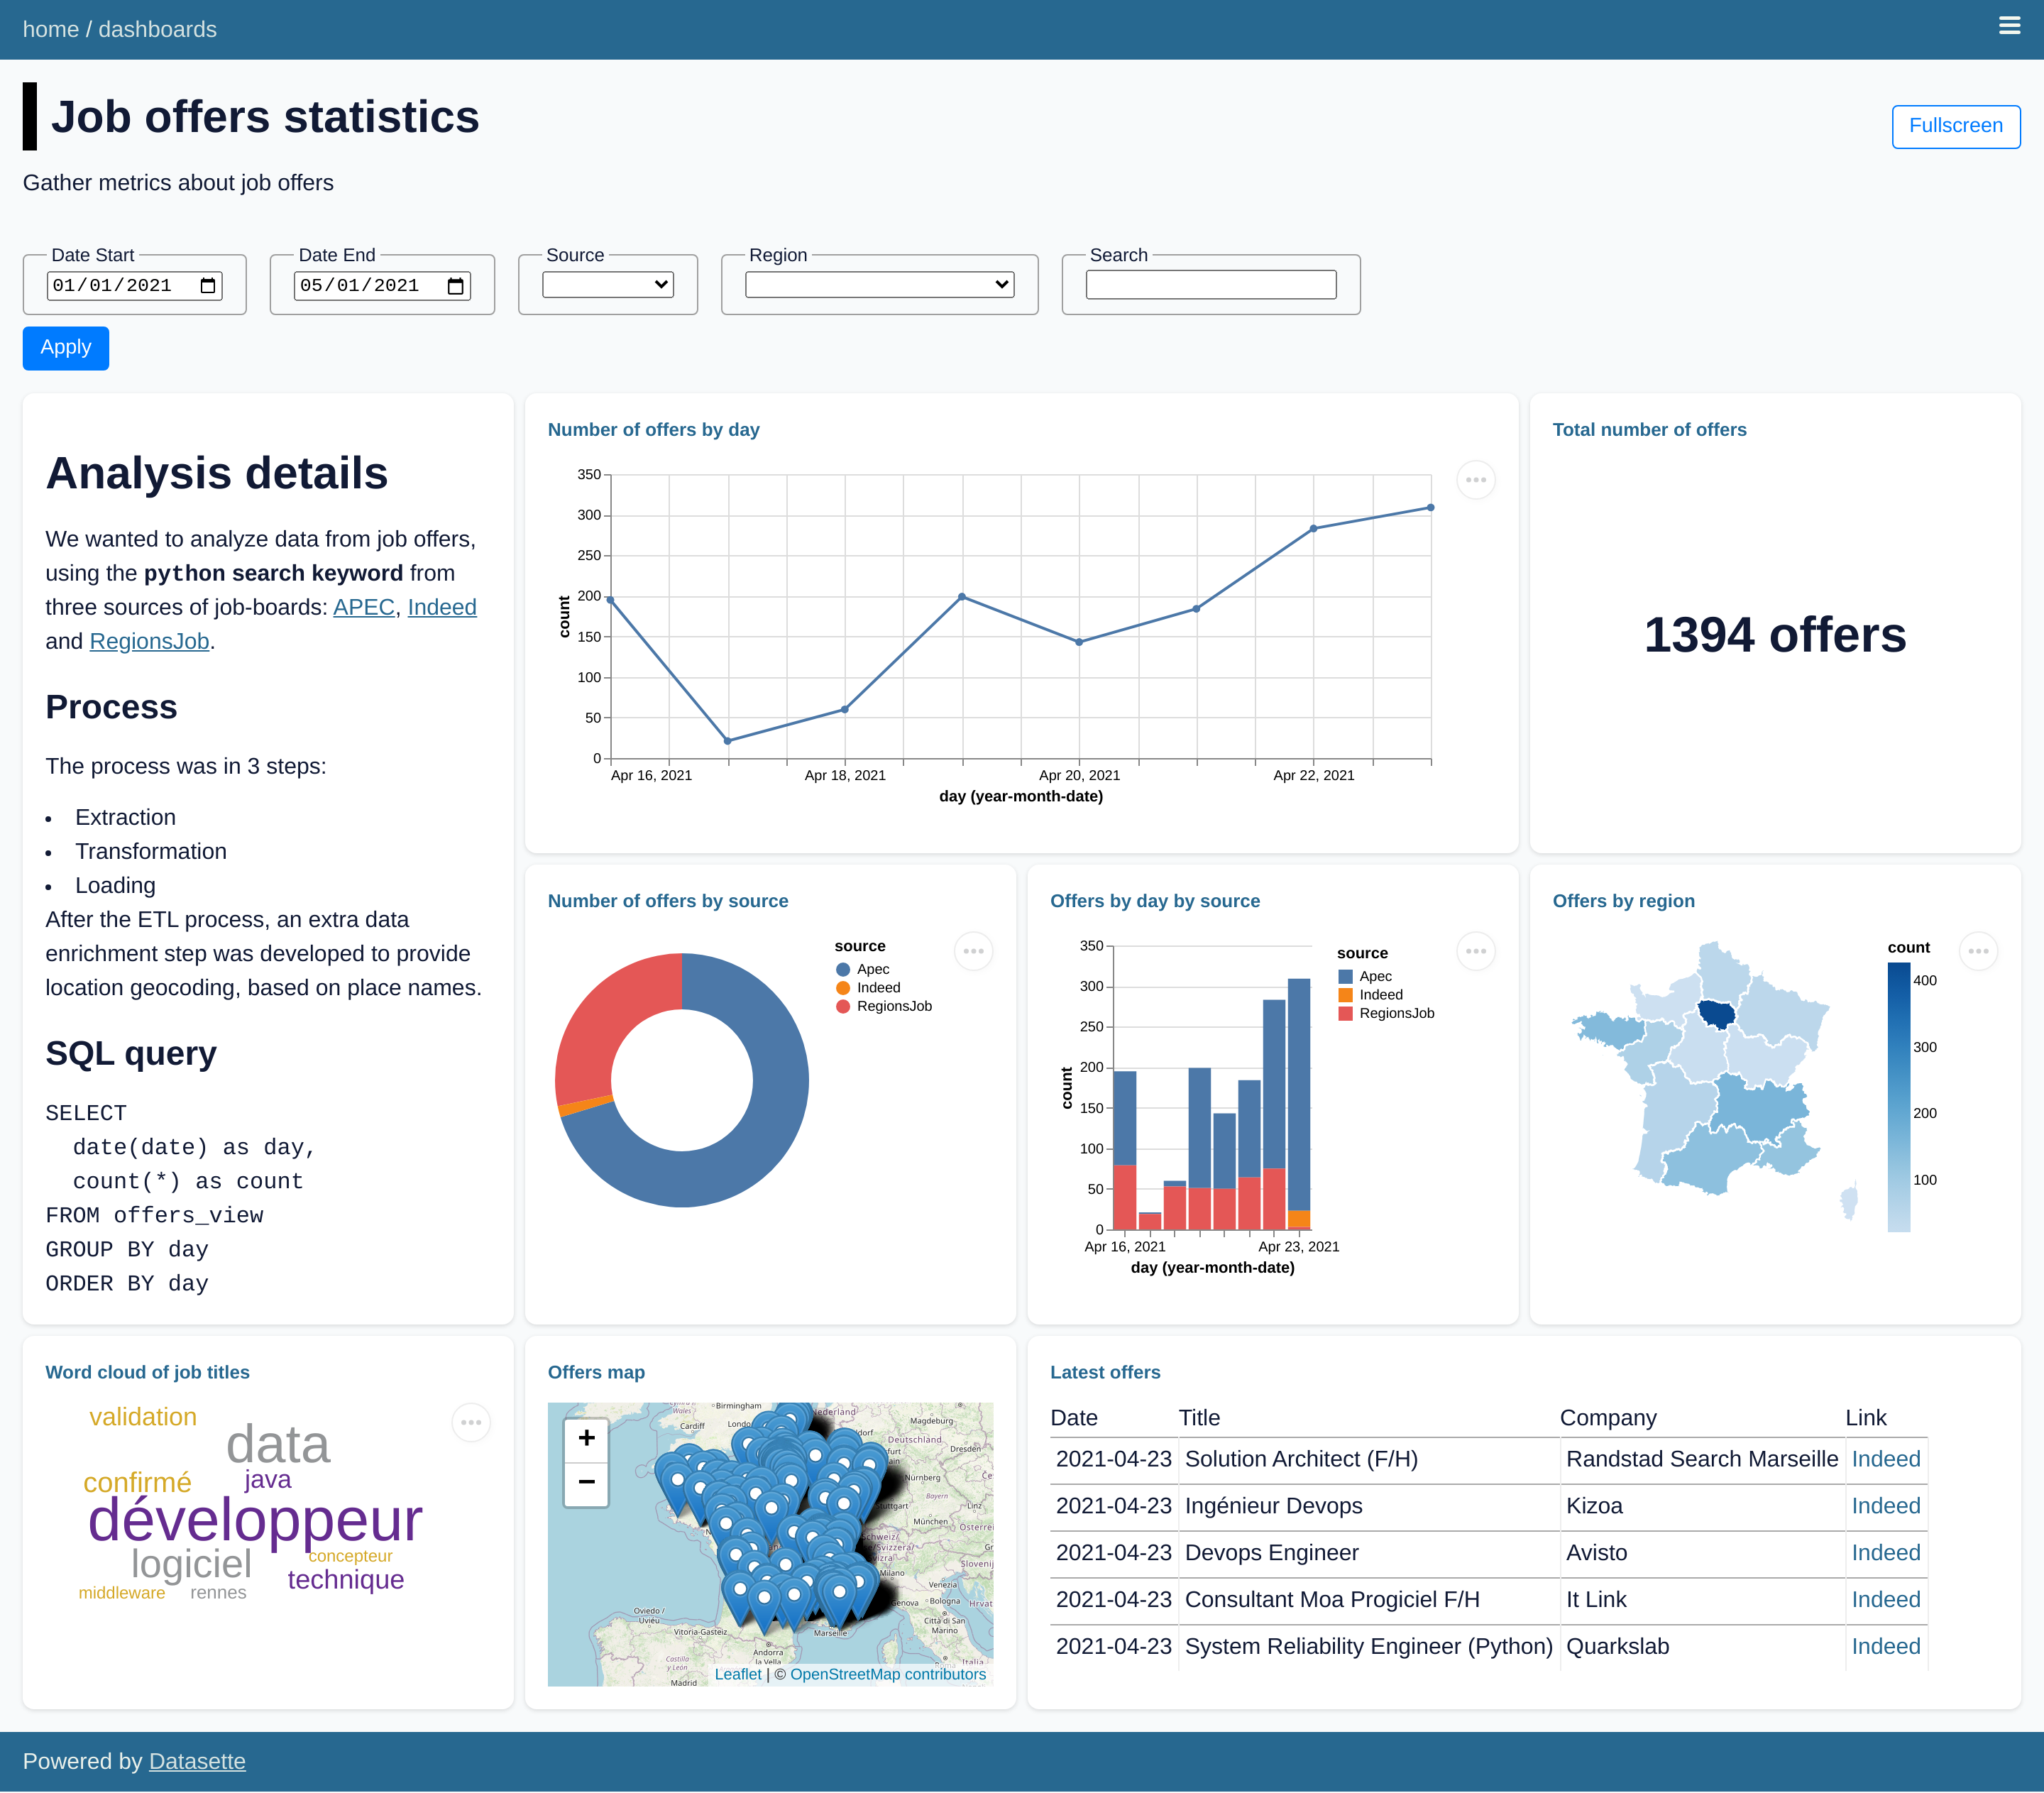
datasette-dashboards
Datasette plugin providing data dashboards from metadata
Try out a live demo at https://datasette-dashboards-demo.vercel.app
WARNING: this plugin is still experimental and not ready for production. Some breaking changes might happen between releases before reaching a stable version. Use it at your own risks!
Installation
Install this plugin in the same environment as Datasette:
$ datasette install datasette-dashboardsUsage
Define dashboards within metadata.yml / metadata.json:
plugins:
  datasette-dashboards:
    my-dashboard:
      title: My Dashboard
      description: Showing some nice metrics
      layout:
        - [analysis-note, events-count]
        - [analysis-note, events-source]
      filters:
        date_start:
          name: Date Start
          type: date
          default: "2021-01-01"
        date_end:
          name: Date End
          type: date
        category:
          name: My Category
          type: select
          options: [Option 1, Option 2, Option 3]
        dynamic_category:
          name: My Dynamic Category
          type: select
          db: jobs
          query: SELECT region FROM jobs ORDER BY region ASC
      charts:
        analysis-note:
          library: markdown
          display: |-
            # Analysis notes
            > A quick rundown of events statistics and KPIs

        events-count:
          title: Total number of events
          db: jobs
          query: SELECT count(*) as count FROM events
          library: metric
          display:
            field: count
            prefix:
            suffix:

        events-source:
          title: Number of events by source
          db: jobs
          query: SELECT source, count(*) as count FROM events WHERE TRUE [[ AND date >= date(:date_start) ]] [[ AND date <= date(:date_end) ]] GROUP BY source ORDER BY count DESC
          library: vega
          display:
            mark: { type: bar, tooltip: true }
            encoding:
              color: { field: source, type: nominal }
              theta: { field: count, type: quantitative }
A new menu entry is now available, pointing at /-/dashboards to access all defined dashboards.
Properties
Dashboard properties:
| Property | Type | Description |
|---|---|---|
title |
string |
Dashboard title |
description |
string |
Dashboard description |
layout |
array |
Dashboard layout |
filters |
object |
Dashboard filters |
Dashboard filters:
| Property | Type | Description |
|---|---|---|
name |
string |
Filter display name |
type |
string |
Filter type (text, date, number, select) |
default |
string, number |
(optional) Filter default value |
min |
number |
(optional) Filter minimum value |
max |
number |
(optional) Filter maximum value |
step |
number |
(optional) Filter stepping value |
options |
list |
(optional) Select filter options list |
db |
string |
(optional) Dynamic select filter database |
query |
string |
(optional) Dynamic select filter query |
Common chart properties for all chart types:
| Property | Type | Description |
|---|---|---|
title |
string |
Chart title |
db |
string |
Database name against which to run the query |
query |
string |
SQL query to run and extract data from |
library |
string |
One of supported libraries: vega, markdown, metric |
display |
object |
Chart display specification (depend on the used library) |
To define SQL queries using dashboard filters:
SELECT * FROM mytable [[ WHERE col >= :my_filter ]]SELECT * FROM mytable WHERE TRUE [[ AND col1 = :my_filter_1 ]] [[ AND col2 = :my_filter_2 ]]Vega properties
Available configuration for vega charts:
| Property | Type | Description |
|---|---|---|
library |
string |
Must be set to vega |
display |
object |
Vega specification object |
Notes about the display property:
- Requires a valid Vega specification object
- Some fields are pre-defined:
$schema,title,width,view,config,data - All fields are passed along as-is (overriding pre-defined fields if any)
- Only
markandencodingfields are required as the bare-minimum
Markdown properties
Available configuration for markdown chart:
| Property | Type | Description |
|---|---|---|
library |
string |
Must be set to markdown |
display |
string |
Multi-line string containing the Markdown content |
Note :
- Some common properties do not apply and can be omitted:
title,db,query - Markdown rendering is done by
datasette-render-markdown - To configure Markdown rendering, extensions can be enabled in metadata
Metric properties
Available configuration for metric chart:
| Property | Type | Description |
|---|---|---|
library |
string |
Must be set to metric |
display.field |
string |
Numerical field to be displayed as metric |
display.prefix |
string |
Prefix to be displayed before metric |
display.suffix |
string |
Prefix to be displayed after metric |
Note:
- The
display.fieldmust reference a single-numerical value from the SQL query (e.g. numericalnumberfield inSELECT count(*) as number FROM events)
Dashboard layout
The default dashboard layout will present two charts per row (one per row on mobile).
To make use of custom dashboard layout using CSS Grid Layout,
define the layout array property as a grid / matrix:
- Each entry represents a row of charts
- Each column is referring a chart by its property name
Development
To set up this plugin locally, first checkout the code. Then create a new virtual environment and the required dependencies:
pipenv install -d
pipenv shell
To run the tests:
pytestDemo
With the developmnent environment setup, you can run the demo locally:
datasette --metadata demo/metadata.yml demo/jobs.dbLicense
Licensed under Apache License, Version 2.0
Copyright (c) 2021 - present Romain Clement


